This project involved analyzing customer data for a New York City-based E-commerce company selling clothing online and through in-store sessions. The goal was to determine whether the company should focus more on their mobile app or website.
- Tools Used: Python, Pandas, NumPy, Matplotlib, Seaborn, Scikit-learn.
Data Overview
The dataset for this project is synthetic and contains simulated customer information for an e-commerce company. It includes details such as email, address, avatar color, as well as numerical values like average session length, time on app and website, length of membership, and yearly spending. This synthetic dataset is designed to mimic real-world data while ensuring privacy and ethical use of data in an educational context.
import pandas as pd
import numpy as np
import matplotlib.pyplot as plt
import seaborn as sns
%matplotlib inline
customers = pd.read_csv("Ecommerce Customers")
Exploratory Data Analysis (EDA)
- Initial Data Analysis: Showed the use of
customers.head(),customers.describe(), andcustomers.info()to understand the dataset. - Visual Exploration:
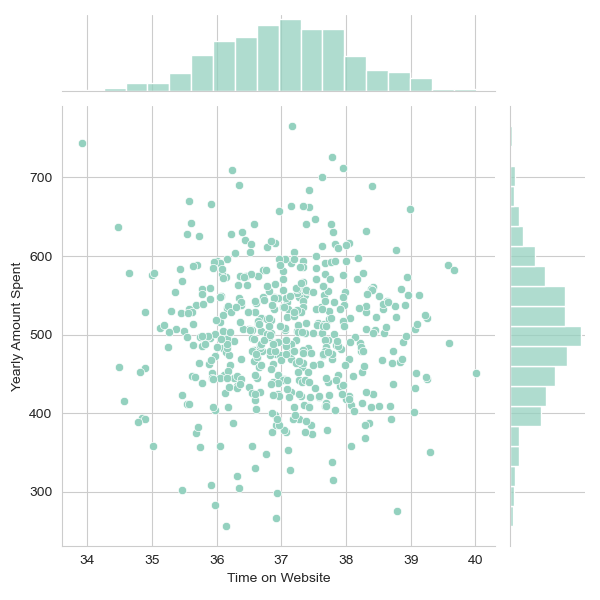
- Displayed joint plots comparing ‘Time on Website’ and ‘Yearly Amount Spent’, and ‘Time on App’ vs ‘Yearly Amount Spent’.
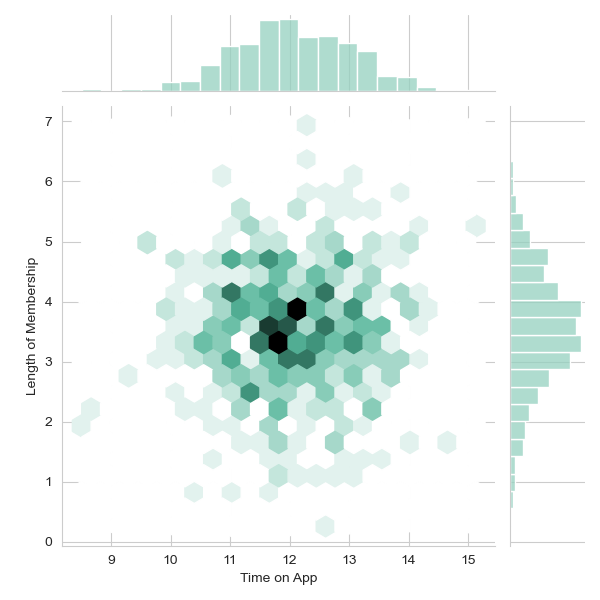
- Explored the relationship between ‘Time on App’ and ‘Length of Membership’ using a hex bin plot.
- Used
sns.pairplotto visualize relationships across the dataset.
# Time on Website vs Yearly Amount Spent
sns.jointplot(x='Time on Website', y='Yearly Amount Spent', data=customers)

# Time on App vs Yearly Amount Spent
sns.jointplot(x='Time on App', y='Yearly Amount Spent', data=customers)

# Pairplot for overall data visualization
sns.pairplot(customers)

In-Depth Analysis
- Key Findings:
- Correlation between Time on Website and Yearly Amount Spent: The jointplot created between ‘Time on Website’ and ‘Yearly Amount Spent’ did not show a very strong correlation. This suggests that simply spending more time on the website does not significantly increase the amount spent by customers.
- Correlation between Time on App and Yearly Amount Spent: In contrast, the jointplot for ‘Time on App’ and ‘Yearly Amount Spent’ indicated a more pronounced correlation. This finding suggests that time spent on the app is more strongly associated with the amount of money customers spend.
- Time on App and Length of Membership: The hex bin plot comparing ‘Time on App’ and ‘Length of Membership’ provided an interesting visual representation, indicating clusters where customers spent varying amounts of time on the app and have differing lengths of membership.
- Overall Data Relationships: The pairplot across the entire dataset offered a comprehensive view of all pairwise relationships, highlighting some key areas for further investigation.
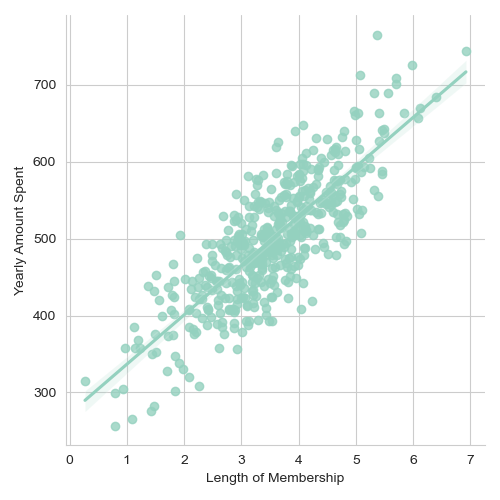
The most significant observation from the EDA was the relationship between ‘Length of Membership’ and ‘Yearly Amount Spent’. The length of time a customer has been with the company appears to be a strong predictor of their annual expenditure.
- Model Insights
- Strong Positive Relationship: The linear model plot revealed a strong positive correlation between ‘Length of Membership’ and ‘Yearly Amount Spent’. This implies that as the length of membership increases, there is a tendency for annual spending to also increase.
- Predictive Power of Membership Duration: The strength of this correlation suggests that the duration of a customer’s relationship with the company is a significant predictor of their spending behavior. This could imply that loyal, long-term customers tend to spend more annually.
- Business Strategy Implication: From a business strategy perspective, this insight could be pivotal. It emphasizes the importance of customer retention and loyalty programs. Focusing on keeping existing customers engaged for longer periods may be more profitable than solely trying to increase time spent on the website or app.
These insights, drawn from the EDA and linear modeling, can guide the E-commerce company in making data-driven decisions to enhance customer engagement and increase revenue. Prioritizing efforts to enhance the customer experience and retain customers for longer durations could be a strategic move for the company.
Model Development
- Data Preparation: Split the data into training and testing sets, focusing on numerical features for model training.
- Model Training: Trained a Linear Regression model. Shared the code and output, highlighting the model’s coefficients.
- Model Coefficients:
- Avg. Session Length: 25.98 dollars increase per unit.
- Time on App: 38.59 dollars increase per unit.
- Time on Website: 0.19 dollars increase per unit.
- Length of Membership: 61.27 dollars increase per unit.
from sklearn.model_selection import train_test_split
from sklearn.linear_model import LinearRegression

# Splitting the data
X = customers[['Avg. Session Length', 'Time on App', 'Time on Website', 'Length of Membership']]
y = customers['Yearly Amount Spent']

X_train, X_test, y_train, y_test = train_test_split(X, y, test_size=0.3, random_state=101)

# Training the model
lm = LinearRegression()
lm.fit(X_train, y_train)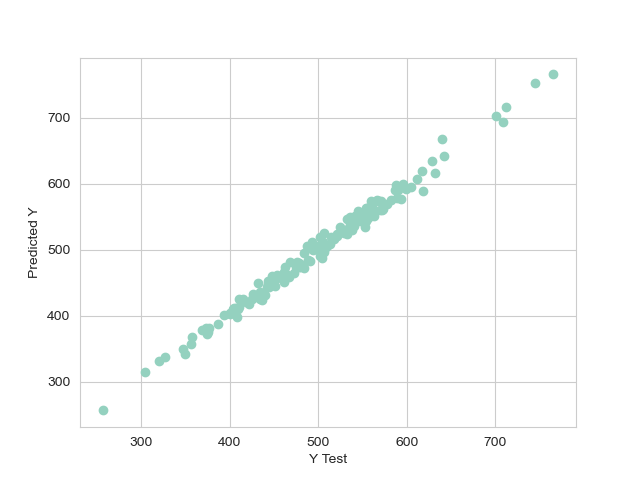
Model Evaluation
- Performance Metrics:
- Mean Absolute Error (MAE): This represents the average absolute difference between the predicted values and the actual values. For our model, the MAE was found to be 7.23, indicating the average magnitude of errors in the predictions.
- Mean Squared Error (MSE): MSE measures the average squared difference between the predicted and actual values, emphasizing larger errors. Our model’s MSE was 79.81, which seems high but needs to be understood in the context of the data scale and distribution.
- Root Mean Squared Error (RMSE): The square root of MSE, RMSE, was 8.93, giving us an idea about the actual deviation of the predicted values from the real ones in the same units as the output variable.
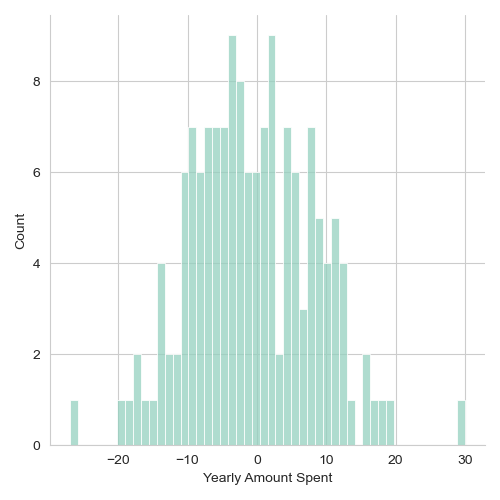
- Residual Analysis: A histogram of the residuals (the differences between the predicted and actual values) was plotted to assess the fit of the model. The distribution appeared to be approximately normal, suggesting that the model’s assumptions were reasonably met, and there were no systematic deviations unaccounted for by the model.
Conclusion and Business Insights
Interpretation of Results
coeffecients = pd.DataFrame(lm.coef_,X.columns)
coeffecients.columns = ['Coeffecient']
coeffecients| Coeffecient | |
| Avg. Session Length | 25.981550 |
| Time on App | 38.590159 |
| Time on Website | 0.190405 |
| Length of Membership | 61.279097 |
Analysis of the coefficients from the linear regression model provided valuable insights:
- Avg. Session Length: A 1 unit increase is associated with an increase of approximately 25.98 dollars in yearly spend.
- Time on App: A 1 unit increase correlates with an increase of 38.59 dollars, signifying a strong relationship between app usage and spending.
- Time on Website: Surprisingly, the impact here is minimal, with only a 0.19 dollar increase for every additional unit spent on the website.
- Length of Membership: The strongest predictor, where each additional year of membership is associated with an increase of 61.27 dollars in spending.
Strategic Recommendations
Given these insights, the company faces a strategic decision:
- Mobile App Focus: The data suggests that the mobile app is more effective in driving revenue. Further investment in and development of the app could potentially yield higher returns.
- Website Improvement: The relatively low impact of website usage on spending could indicate an area for improvement. Aligning the website’s effectiveness with that of the mobile app could open up another channel for revenue growth.
- Leveraging Membership: The length of membership is a strong predictor of spending. Focusing on customer retention and enhancing the value provided to long-term members could be a key strategy.
Reflections and Learning Outcomes
- Skills Gained: Throughout this project, I’ve significantly sharpened my skills in data analysis and interpretation. I’ve learned how to effectively leverage tools like Python, Pandas, and Seaborn to extract meaningful insights from complex datasets. My ability to create predictive models has also improved, particularly in understanding how different variables can influence outcomes.
