Introduction
This project explores the application of the KMeans Clustering algorithm, an unsupervised learning technique, to categorize universities into two groups: Private and Public.
Notably, the project challenges the typical use of KMeans by comparing the algorithm’s output against known labels, providing a unique perspective on the performance of unsupervised learning in a structured context.
The Data
The dataset features 777 universities with 18 variables covering a wide range of metrics like application numbers, acceptance rates, enrollment figures, and several financial and academic aspects. These data points create a comprehensive landscape for applying KMeans clustering.
Data Preparation and Exploration
Essential data preparation steps were followed by exploratory data analysis (EDA) using seaborn and matplotlib. This phase included creating scatterplots and histograms to visualize the relationships between different variables, such as graduation rates and financial aspects.


- Histogram of Graduation Rate (Grad.Rate)
- Shows the distribution of graduation rates across the universities.
- We can observe two peaks, suggesting that there might be two groups of universities with distinct graduation rates.
- Histogram of Out-of-State Tuition (Outstate)
- The second histogram illustrates the distribution of out-of-state tuition costs.
- It seems that private universities (blue) tend to have higher tuition costs compared to public ones (orange).
- There’s a clear distinction between the two types of universities based on out-of-state tuition, which could be an important feature for clustering.
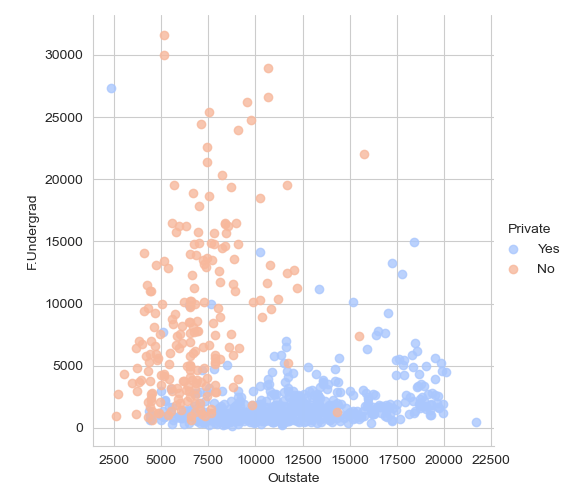
- Scatter Plot of Full-time Undergraduates (F.Undergrad) vs. Out-of-State Tuition (Outstate)
- This scatter plot shows the relationship between the number of full-time undergraduates and out-of-state tuition costs, with points colored by the university type (Private or Public).
- Generally, public universities appear to have more full-time undergraduates and lower out-of-state tuition, whereas private universities have higher tuition costs but less full-time undergraduates.
- There is some overlap in the middle region, suggesting some private universities have tuition costs similar to public ones.
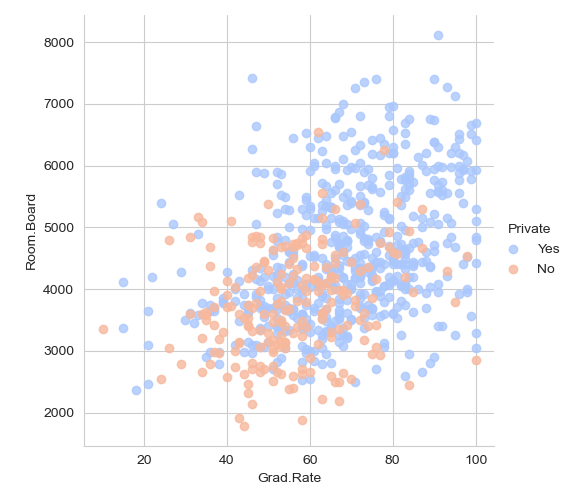
- Scatter Plot of Graduation Rate (Grad.Rate) vs. Room and Board Costs (Room.Board)
- This scatter plot compares the graduation rate to the room and board costs, with points colored by the university type.
- There doesn’t seem to be a clear, strong relationship between room and board costs and graduation rates for either group.
- Both private and public universities display a wide range of room and board costs and graduation rates without a visible pattern indicating a direct correlation between these two features.
K Means Cluster Creation
The core of this project involved utilizing SciKit Learn’s KMeans module to create a model with two clusters. The model was trained on all data except the ‘Private’ label to emulate a real-world scenario where labels are unknown during the clustering process.
from sklearn.cluster import KMeans
kmeans = KMeans(n_clusters=2)
kmeans.fit(df.drop('Private',axis=1))
Evaluation
A novel aspect of this project was the post-clustering evaluation using a confusion matrix and classification report. This allowed for a comparison between the algorithm-generated clusters and the actual university types (Private or Public).
| precision | recall | f1-score | support | |
| 0 | 0.21 | 0.65 | 0.31 | 212 |
| 1 | 0.31 | 0.06 | 0.1 | 565 |
| accuracy | 0.22 | 777 | ||
| macro avg | 0.26 | 0.36 | 0.21 | 777 |
| weighted avg | 0.29 | 0.22 | 0.16 | 777 |
- For Public universities (label 0), precision is 0.21, which means that out of all the instances where the model predicted the university to be public, only 21% were actually public.
- For Private universities (label 1), precision is 0.31, indicating that the model was correct 31% of the time when it predicted a university was private.
The classification report shows that the K Means clustering model did not perform very well in distinguishing between private and public universities based on the given features.
However, it’s important to note that K Means is an unsupervised algorithm, and using it in conjunction with known labels is just for the exercise’s purpose. In real-world applications of K Means, labels are not available, and the algorithm’s performance is not typically evaluated in this manner. The goal of K Means is to group data into coherent clusters, not necessarily to match pre-existing labels.
Conclusion
The KMeans Clustering Project on University Data offered insightful engagement with unsupervised learning. It highlighted the capabilities and limitations of KMeans in clustering complex, real-world data without prior knowledge of categories.
The project demonstrated my analytical skills in applying and evaluating machine learning algorithms, underscoring my ability to derive meaningful insights from unstructured data.
