This project focuses on analyzing a dataset from a simulated advertising campaign to predict user behavior, specifically whether an internet user will click on an advertisement. The analysis employs Logistic Regression to determine the likelihood of a user clicking on an ad based on various user features.
Tools Used: Python, Pandas, NumPy, Matplotlib, Seaborn, Scikit-learn.
Data Overview
The dataset is synthetic, simulating user behavior and characteristics in an online advertising context. Key features include ‘Daily Time Spent on Site’, ‘Age’, ‘Area Income’, ‘Daily Internet Usage’, and a binary variable for sex, ‘Male’, among others. This dataset provides a comprehensive view of user demographics and online behavior patterns.
Exploratory Data Analysis (EDA)
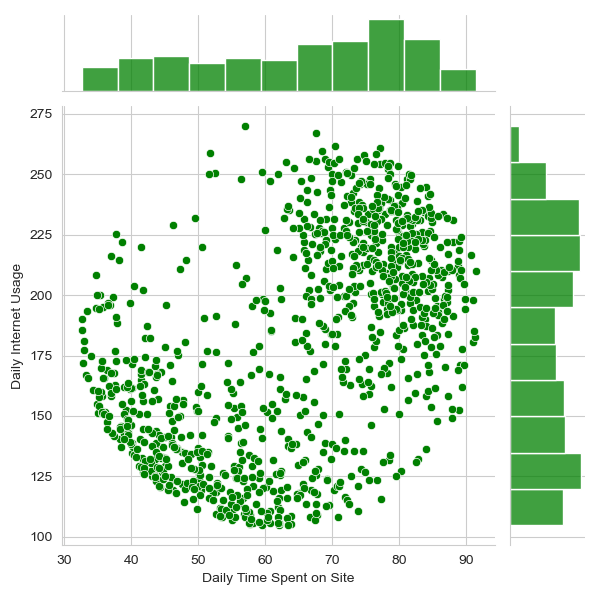
- Age vs. Daily Time Spent: A joint KDE plot shows that the highest concentration of users is around the age of 30, spending about 80 minutes on the site daily.
- Daily Time Spent on Site vs. Daily Internet Usage: The joint scatter plot reveals a positive correlation between the time spent on the site and daily internet usage.
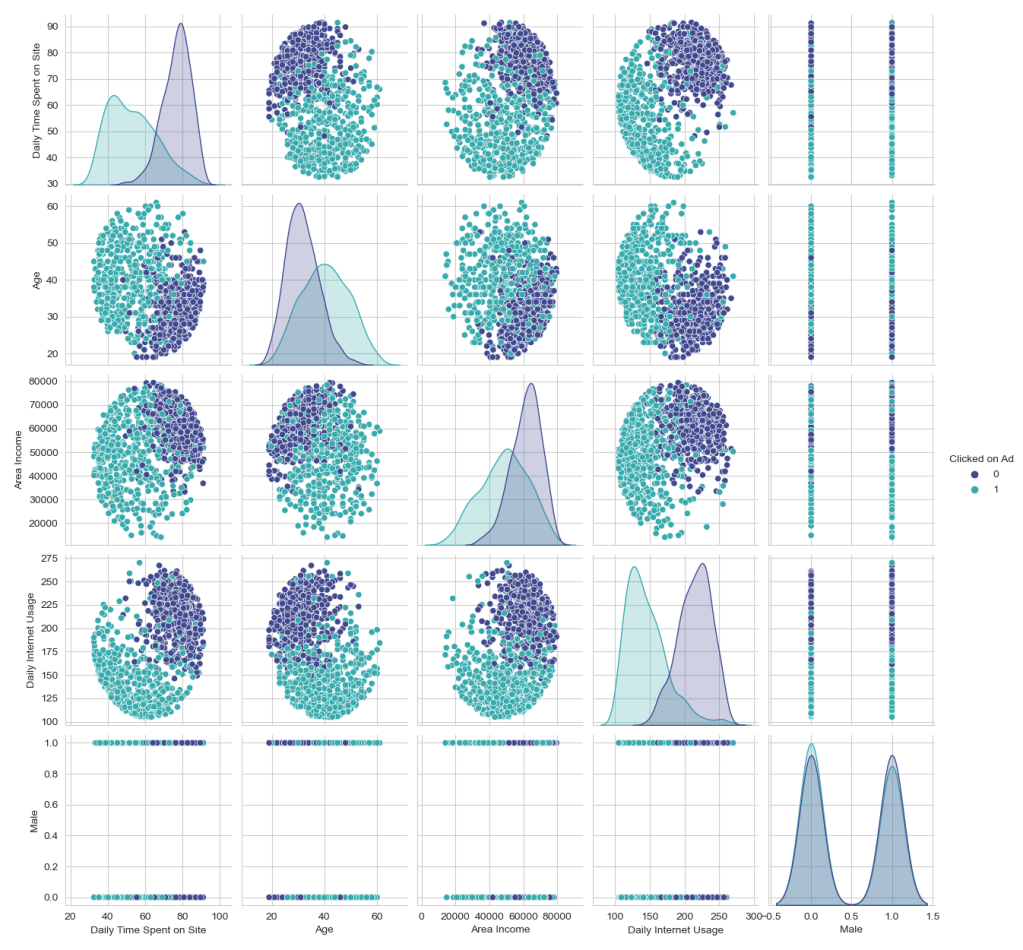
- Pairplot: The pairplot with hues representing whether the ad was clicked indicates clear patterns of user engagement across different demographics and behaviors.


In-Depth Analysis
- Key Findings:
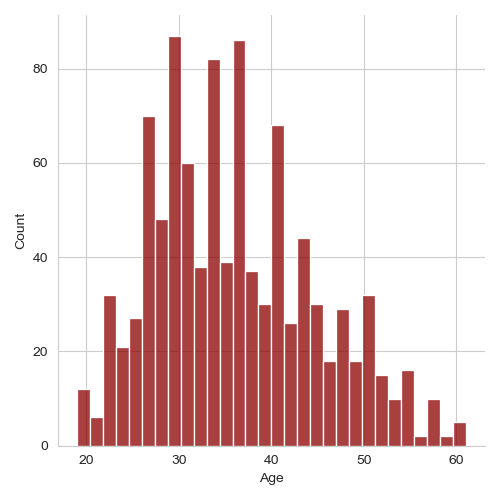
- Younger users tend to spend more time on the site, which could be a target demographic for certain types of ads.
- The pairplot showed distinctions in behavior patterns between users who clicked on ads and those who did not, indicating the potential for targeted advertising.
Model Development
- Data Preparation and Model Training:
- Split the dataset into training and testing sets, using features such as ‘Daily Time Spent on Site’, ‘Age’, ‘Area Income’, ‘Daily Internet Usage’, and ‘Male’.
- Trained the Logistic Regression model and interpreted the coefficients to understand the influence of each feature.
from sklearn.model_selection import train_test_split
from sklearn.linear_model import LogisticRegression

X = ad_data[['Daily Time Spent on Site', 'Age', 'Area Income','Daily Internet Usage', 'Male']]
y = ad_data['Clicked on Ad']

# Splitting and training the model
X_train, X_test, y_train, y_test = train_test_split(X, y, test_size=0.33, random_state=42)
logmodel = LogisticRegression()
logmodel.fit(X_train,y_train)
Model Evaluation
- Performance Metrics:
- Accuracy: 91%
- Precision: High precision indicates that the model is good at predicting user clicks.
- Recall: The model is better at identifying users who are likely to click on ads.
- F1-Score: Balanced F1-score suggests a good balance between precision and recall.
| Precision | Recall | f1-score | Support | |
| 0 | 0.86 | 0.96 | 0.91 | 162 |
| 1 | 0.96 | 0.85 | 0.90 | 168 |
| Accuracy | 0.91 | 330 | ||
| Macro Avg. | 0.91 | 0.91 | 0.91 | 330 |
| Weighted Avg. | 0.91 | 0.91 | 0.91 | 330 |
Conclusion and Business Insights
The model showed strong performance in predicting user behavior regarding ad clicks. The insights could be used to tailor advertising strategies to target demographics more effectively.
- Strategic Recommendations:
- Target Younger Demographics: The analysis shows that younger users spend more time on the site. Advertisements that are likely to appeal to this demographic should be prioritized.
- Personalization: Personalize ads based on the user’s previous interactions with the site, which could increase the likelihood of engagement.
- Retargeting Strategies: For users who did not click on ads but fit the profile of those who are likely to click, develop retargeting campaigns with personalized messaging or special offers.
Reflections and Learning Outcomes
Skills Gained: Enhanced understanding of Logistic Regression in a real-world application, improved data visualization skills, and gained insights into user behavior in the context of online advertising.
Code Repository
- GitHub Link
